
Early on we focused on diagrams of program and programmatic relationships (bubbles and blocks) and of the sharing concepts introduced in the studio. These diagrams should reappear in some form in your final projects but now that you have developed buildings there are additional diagrams you should consider incorporating into your final presentation.
Narrative Diagrams
A single diagram can convey the the main concept for a project, but often it takes a brief narrative to explain your concept: so think about how a series of diagrams can show the development of your ideas.
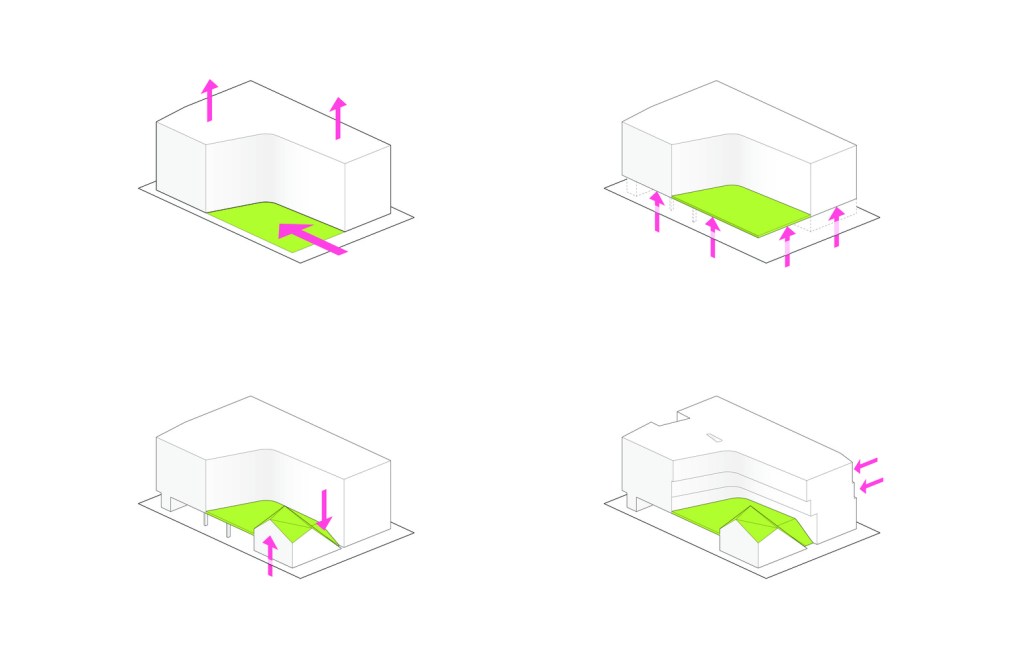
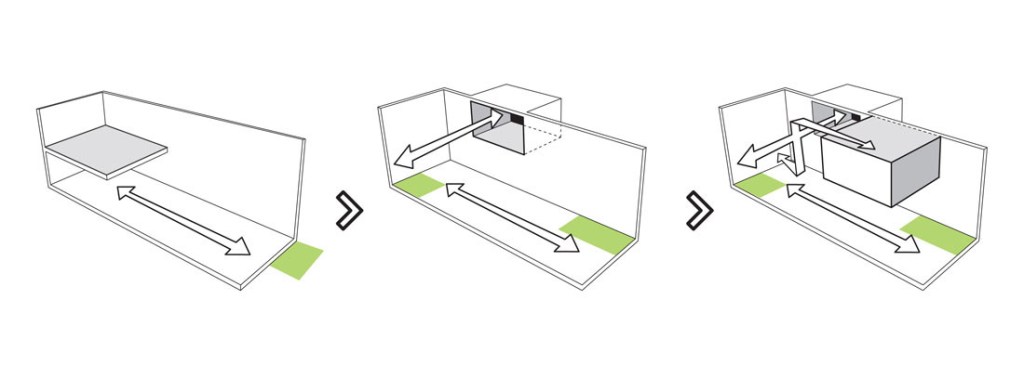
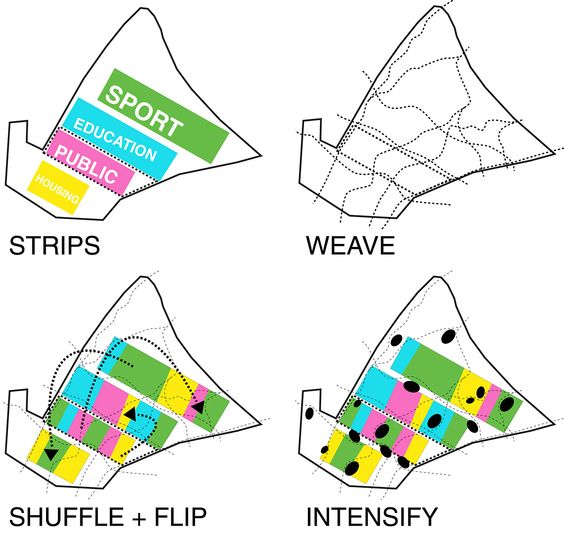
The technique of narrative diagrams is commonly used to show the cumulative effects of a series of formal maneuvers (like above) or the major concept(s) behind a project:
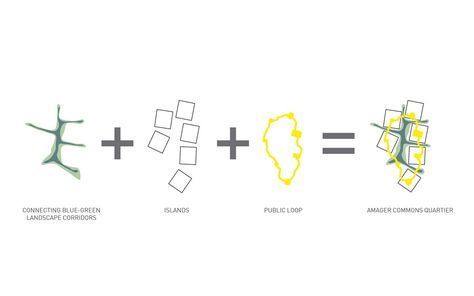
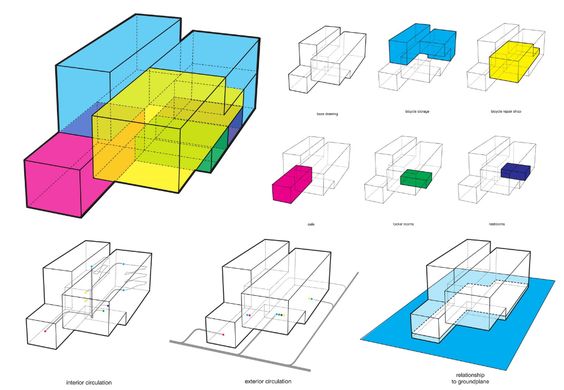
additive diagrams identify components individually then show combined 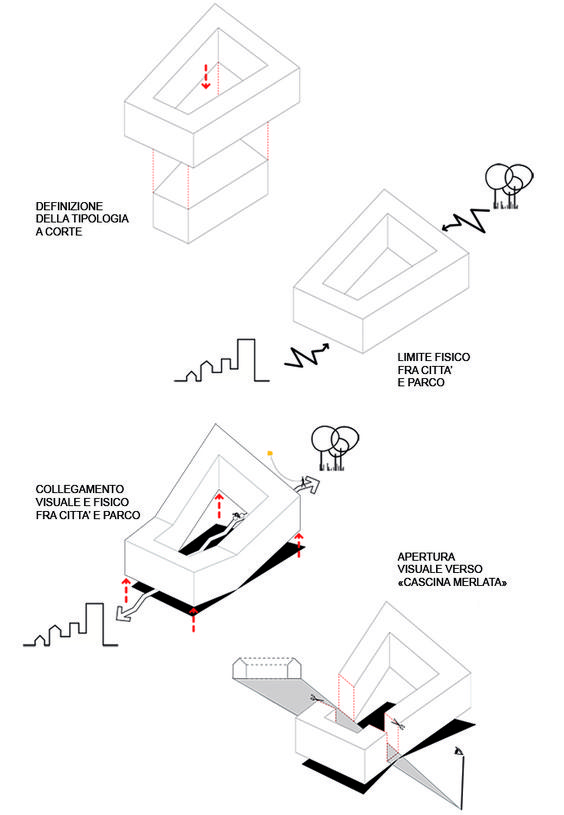
starting point (a normative typology) then modifications to get to the final form 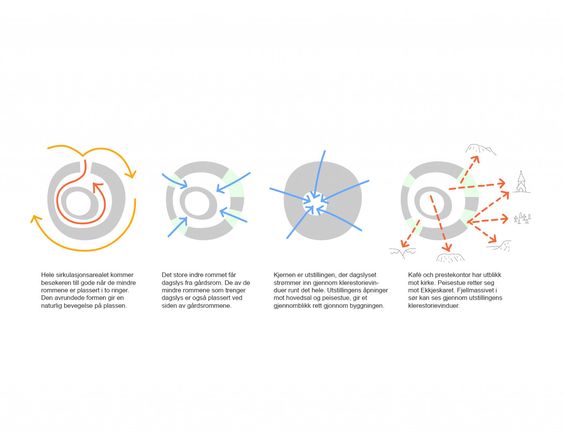
multiple considerations: circulation, entry, gathering, view 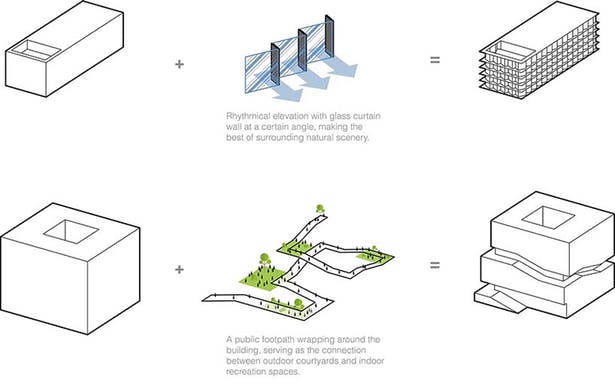
starting point plus primary design move defining building 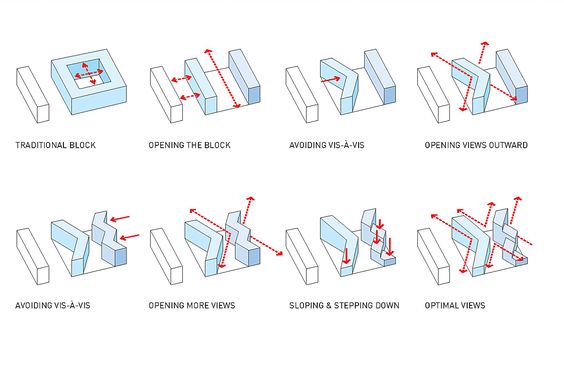
series of maneuvers used to generate building form
Other Concept Diagrams
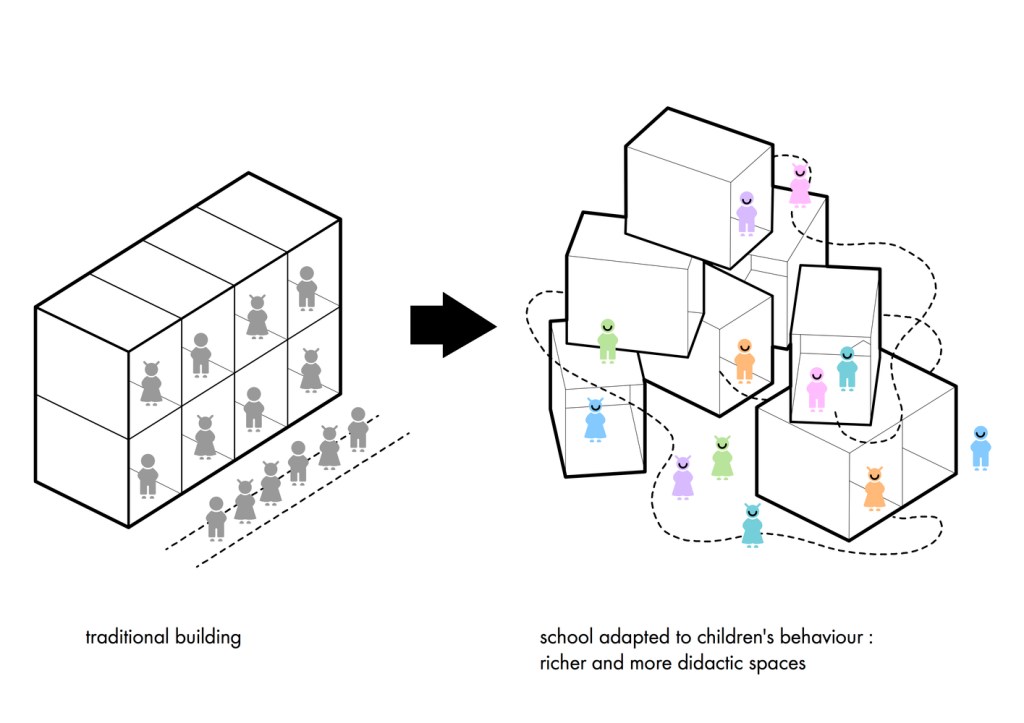
Prominent in contemporary projects are diagrams that contrast a project’s approach to a more generic arranging of program or generating of form: “this is how it’s normally done, and this is my (assumed better) way”
Formal Diagrams
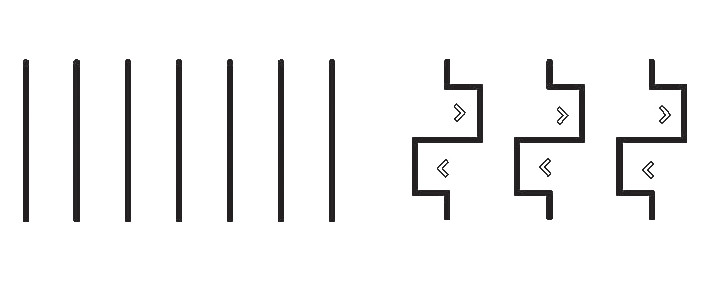
Formal diagrams can also abstractly explain the major design move of a project or clarify formal aspects of the design:
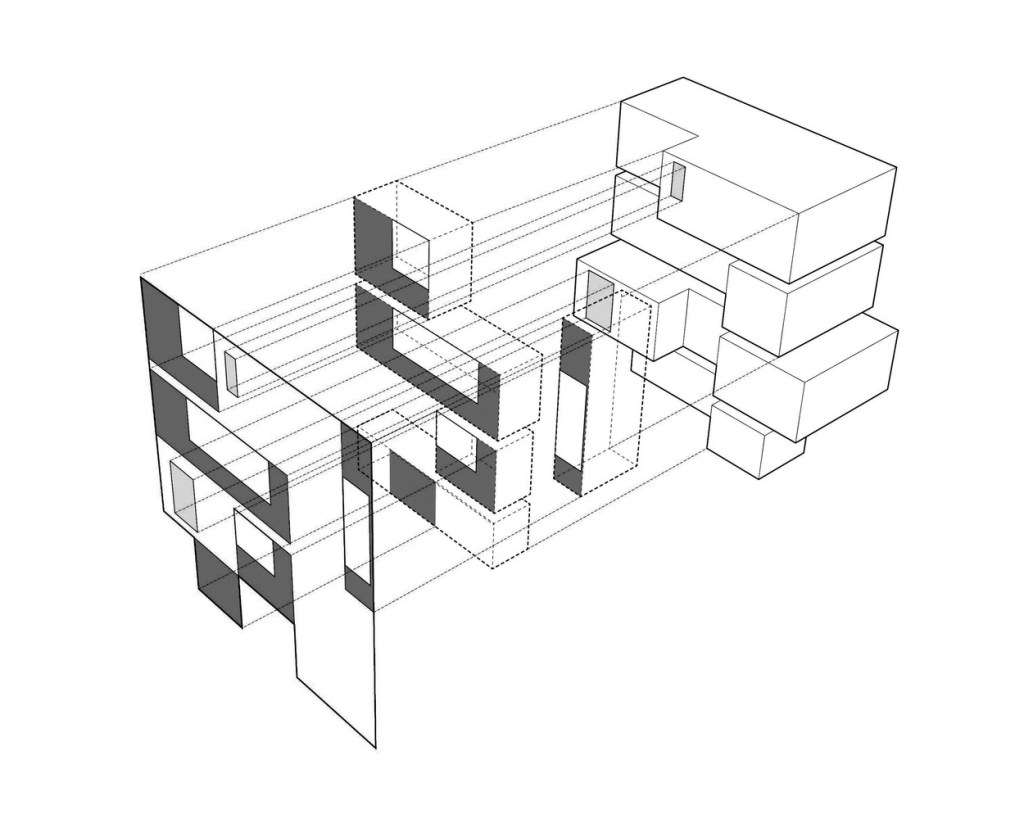
In earlier eras concept diagrams could be consistently described as “parti” diagrams, trying to capture the overall organizing principals of a project, including geometry, proportion, hierarchy, solid/void, or figure/ground.
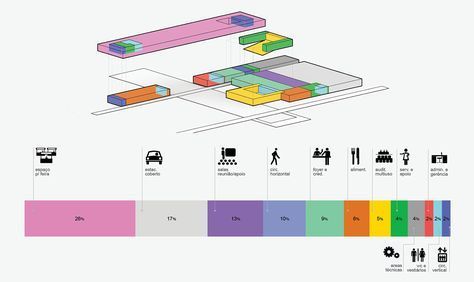
Program Diagrams
Before midterm these diagrams were basically the design of your project and ideally informed the development of it in the following weeks. Now, new versions of the diagrams can easily be made as overlays of floor plans or 3D views of your actual building. But remember the idea of the diagram is to simplify and abstract to highlight one aspect of the design: your program diagram should help reviewers understand the basic concept behind your organization of program in a way that they can visually connect it to your more detailed architectural drawings.


Circulation Diagrams
We’re all pretty comfortable with drawing freehand arrows over our plans and walking people through our plans verbally with finger pointing. When presenting digitally you do have a cursor (or pointer) but you should also consider when to include the circulation on your drawings or as separate diagrams, The next step is to think about what other aspects of circulation are you conveying, which may affect the choice of how best to represent:
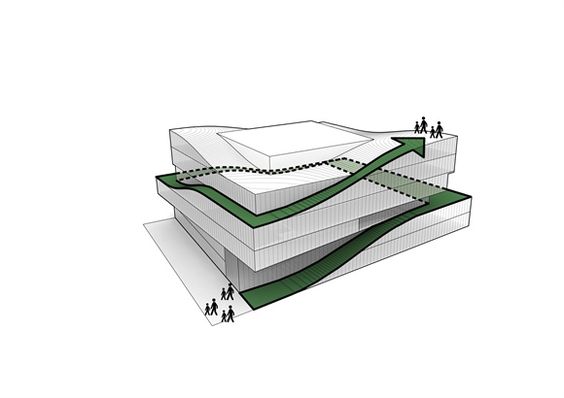
abstract 3D view to create a circulation diagram 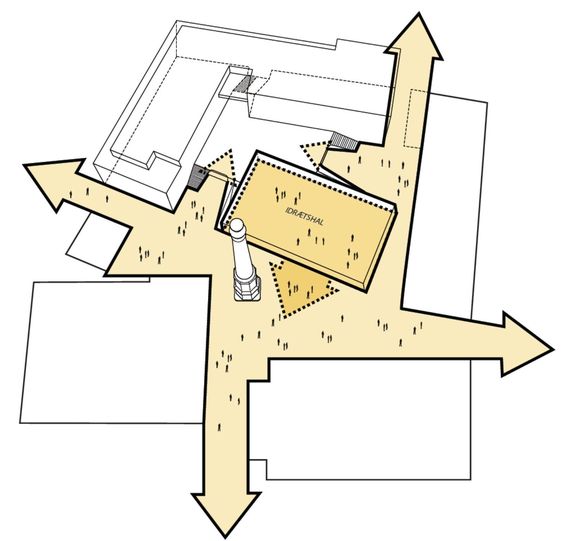
connecting site circulation to interior public space 
the surfaces of experiential circulation (orange) and functional vertical circulation (white stairs) 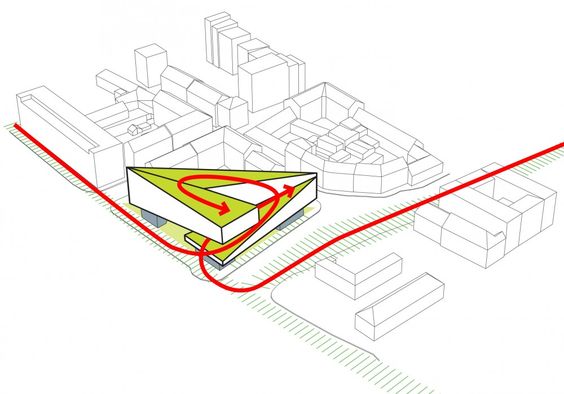
connecting circulation on site to broader context 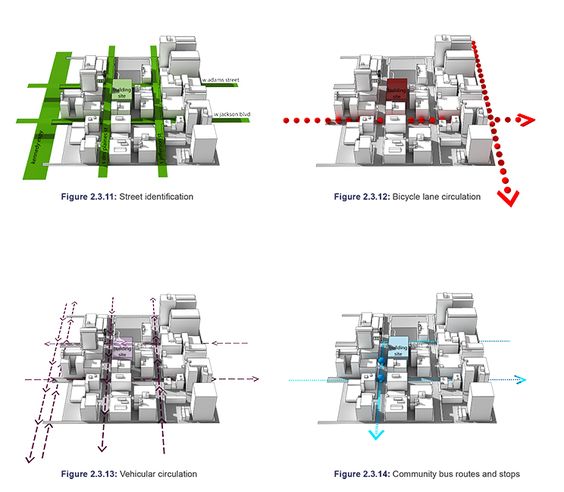
separate circulation diagrams to more clearly show difference and hierarchy 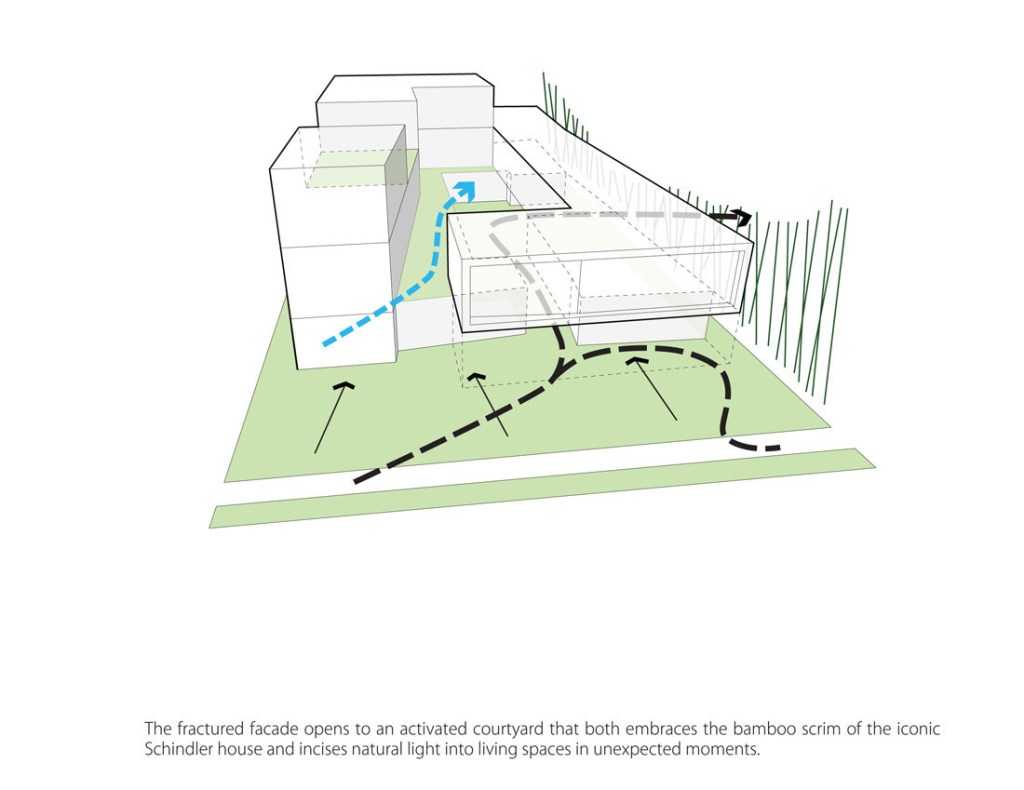
design moves based on circulation, light, and adjacent context
Site and Context Diagrams
Before a project has been designed these diagrams can help identify and isolate physical or experiential characteristics of the project site that may inform a design. Later in the process, diagrams of the actual design can be created to show specifically how your design responds to those same items.
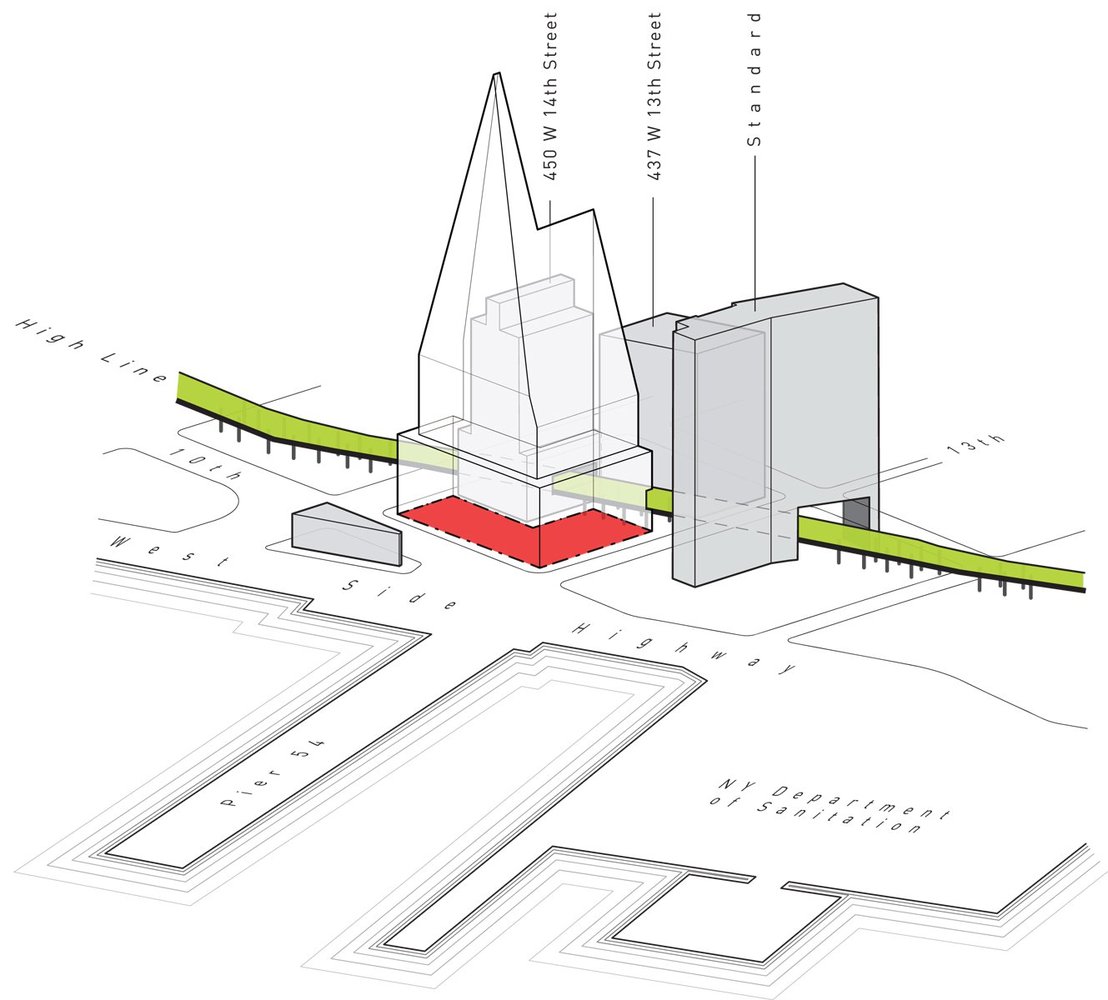
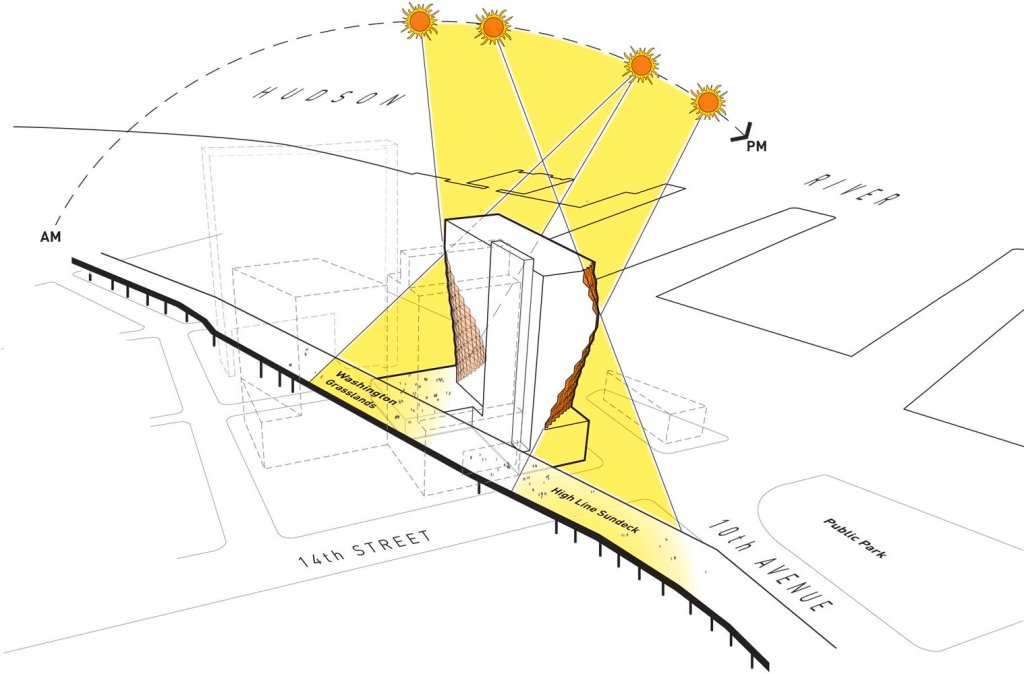
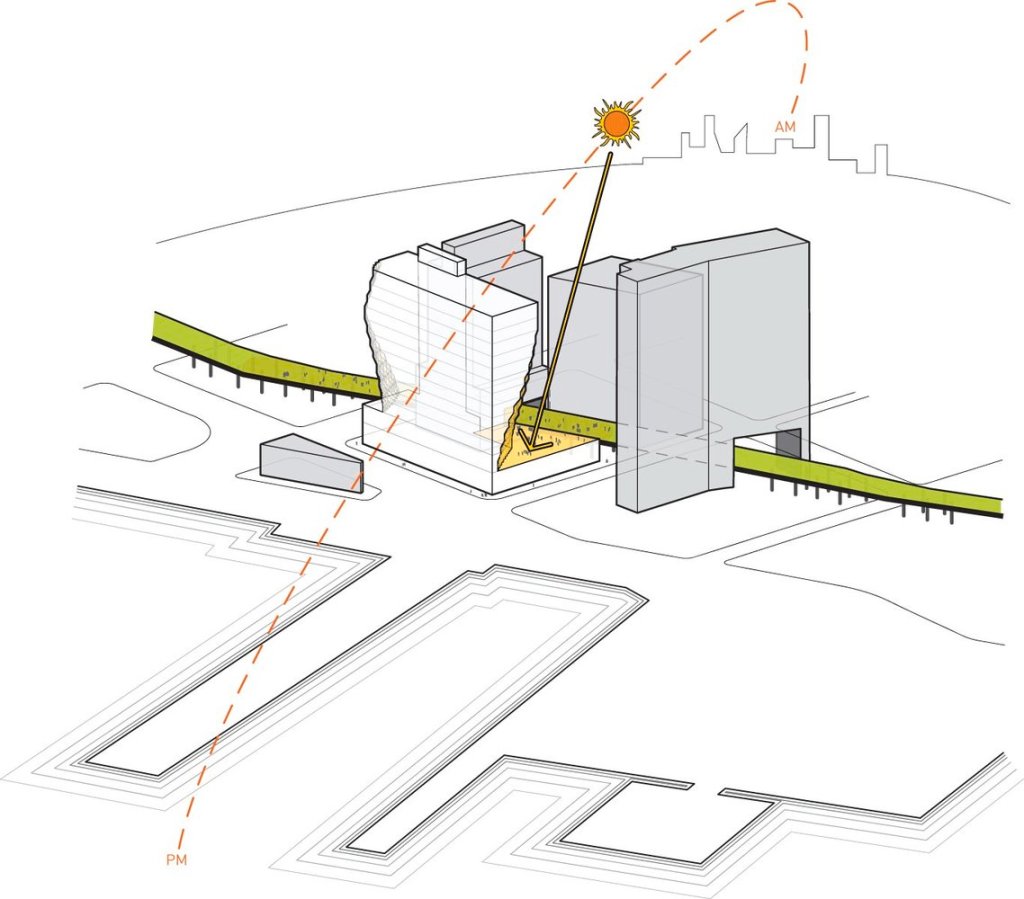
the starting point for the Studio Gang Solar Carve tower identifying the significant context and zoning envelope 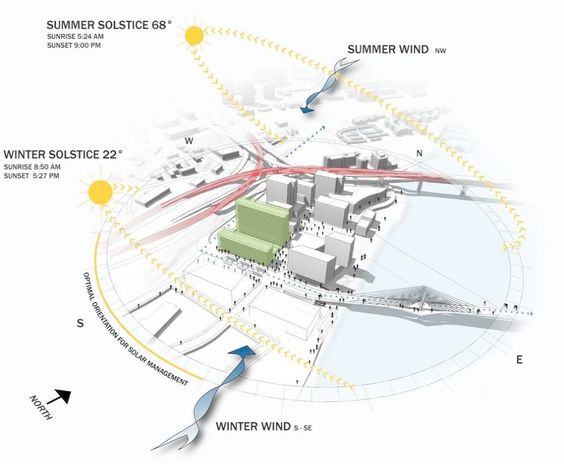
site context of sun and wind, but also roads and adjacent buildings 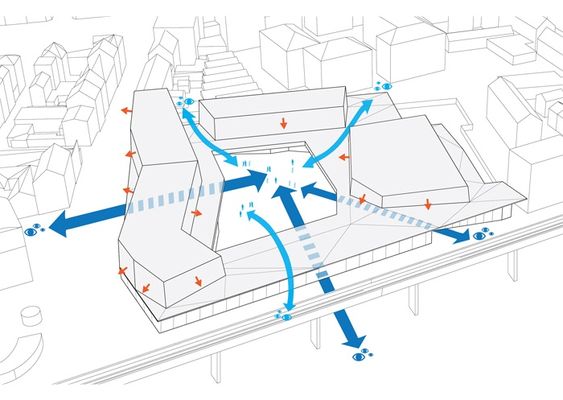
circulation and view into a site, factoring in the adjacent context 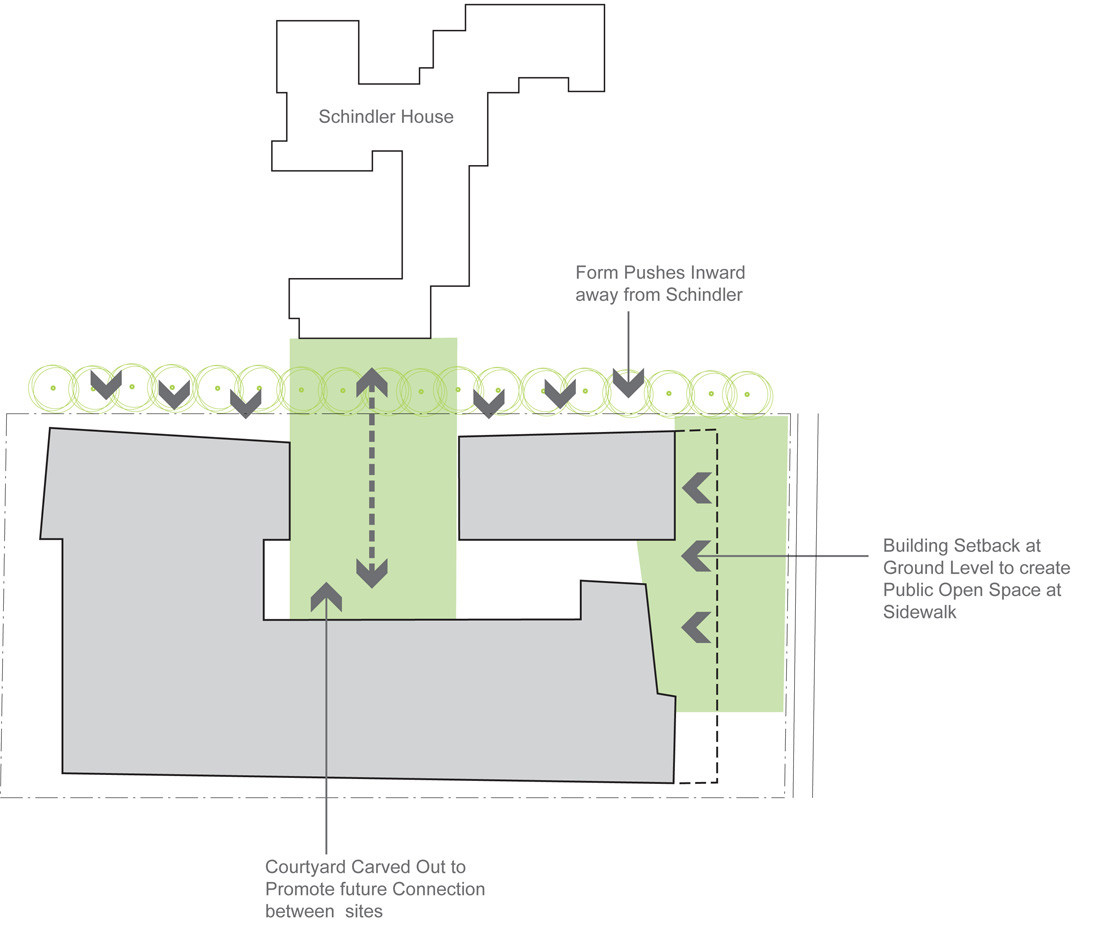
Explaining the reasoning behind the major site design moves 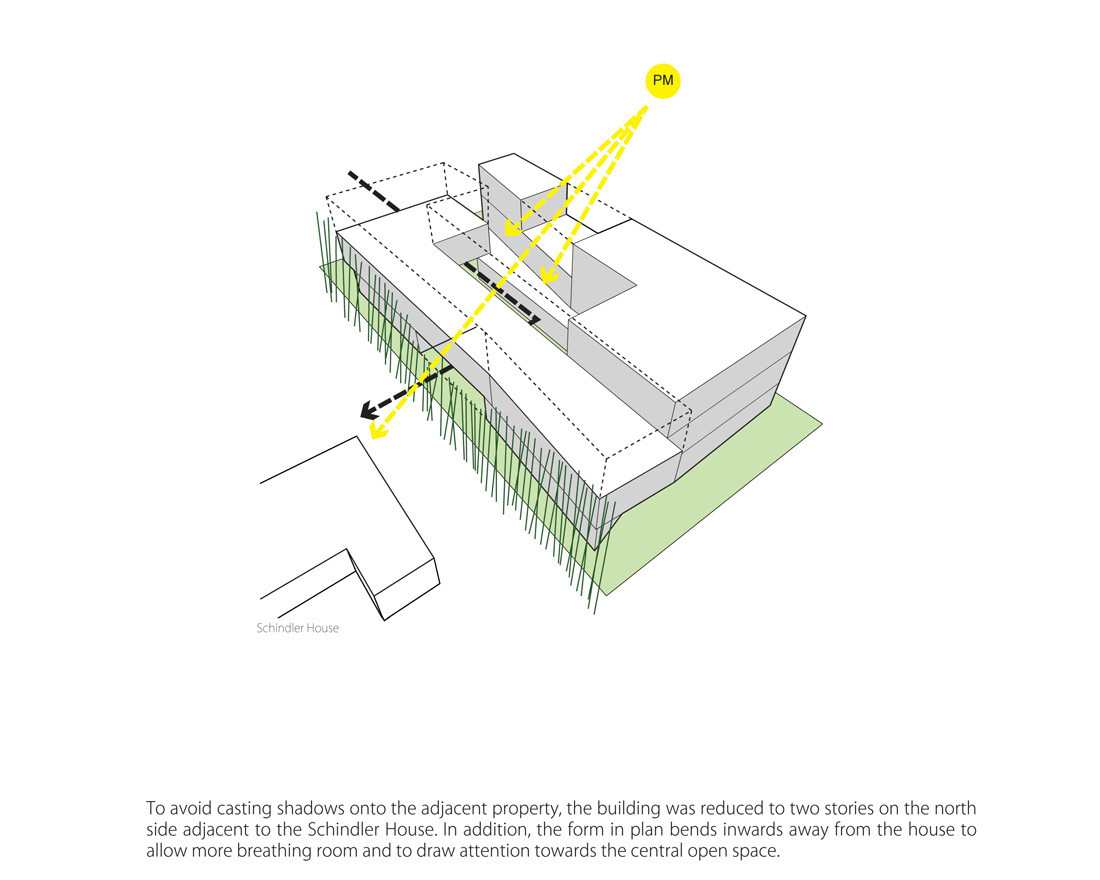
Site design move based on solar access to adjacent building
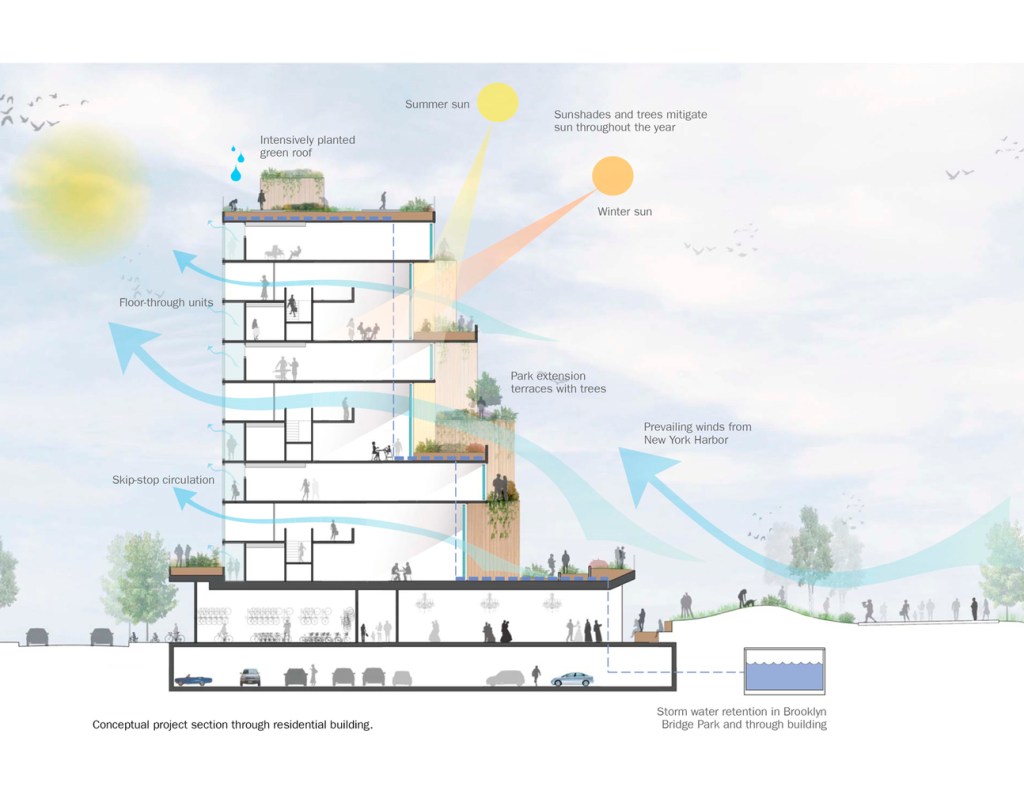
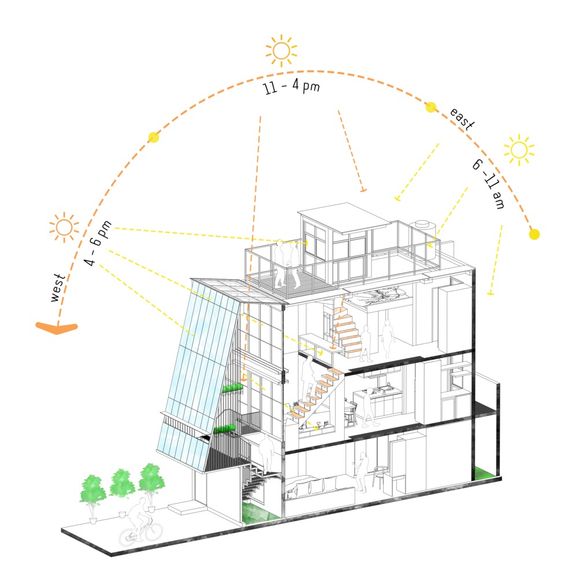
Solar Diagrams
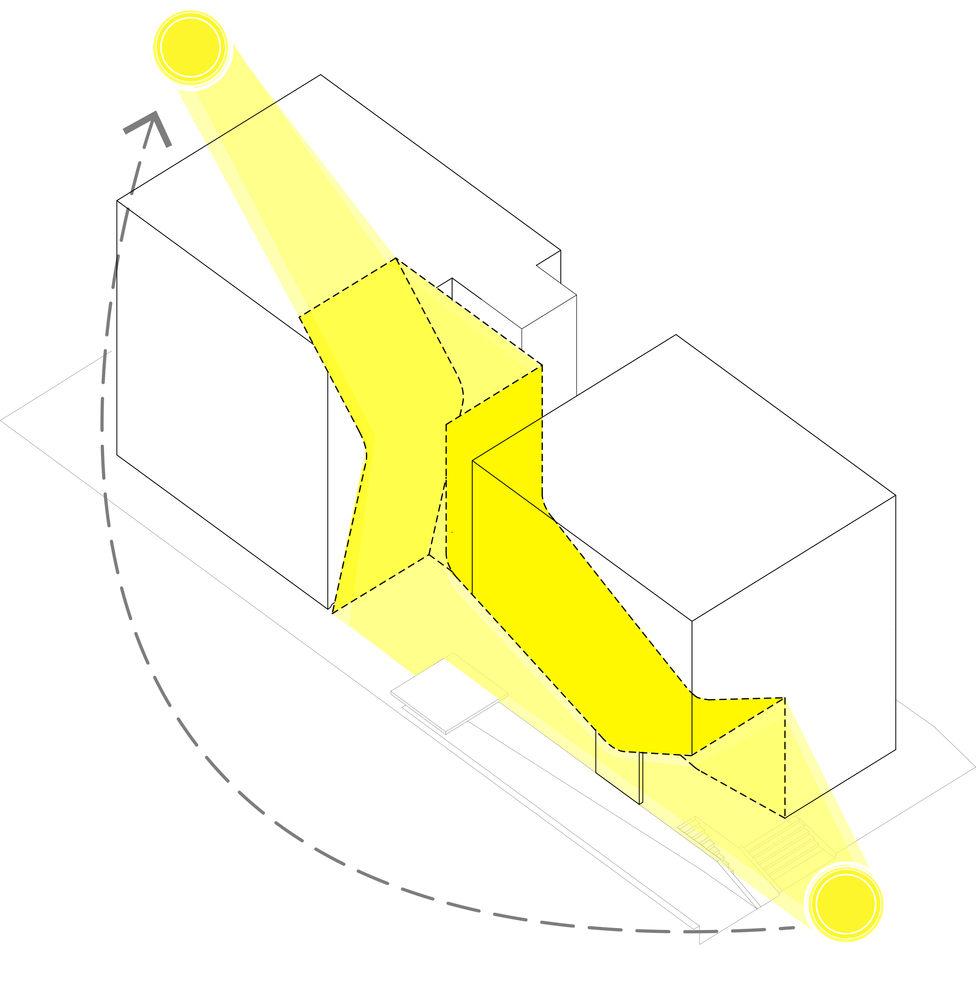
A common site diagram you should all have a version of in your presentation. During the design process, solar diagrams are mostly about understanding the sun’s path in different seasons and anything about your site that might affect solar access. But at this point solar diagrams should show how your design responds to or was influenced by the path of the sun. A series created by Studio Gang to demonstrate the role of the sun in shaping the form of a tower:

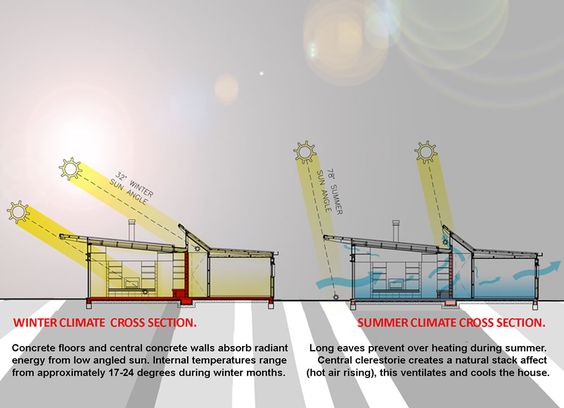
Some more general solar diagrams:
A pair of diagrams showing the carving away of building mass for solar access and the insertion of circulation into the resulting void.

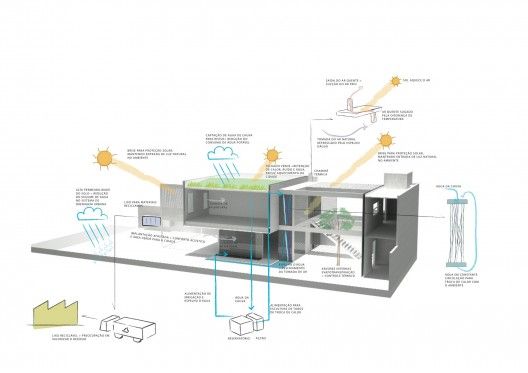
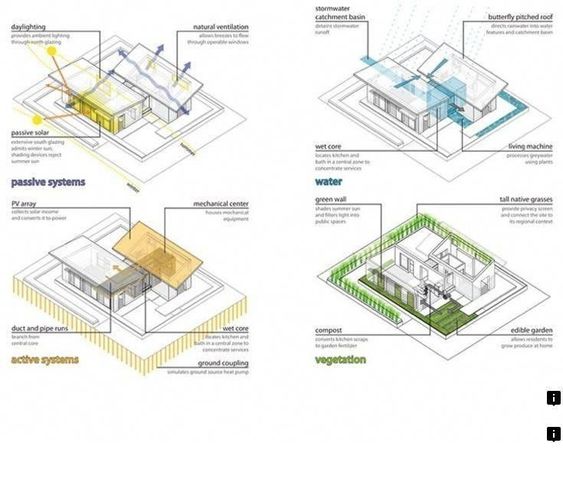
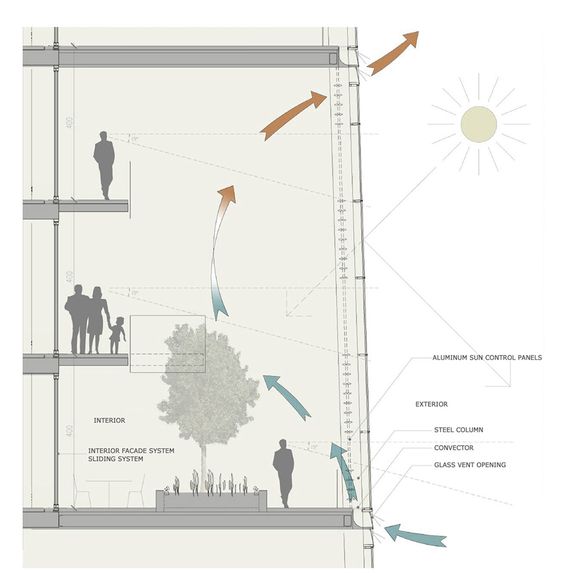
Other Environmental Diagrams
If your project has been designed to consider ventilation (and/or wind), rain, or other environmental factors which may not be clear in your regular drawings, you can diagram this, similar to the solar diagrams.
If your project has been designed to consider ventilation (and/or wind), rain, or other environmental factors which may not be clear in your regular drawings, you can diagram this, similar to the solar diagrams.