
Overview
This post is meant as a (re)introduction to some of the diagramming techniques introduced last year. We’ll tailor this to the first project but also use it as a base for continuing to explore diagrams as we progress through this semester’s projects.
DIAGRAM. NOUN. A simplified drawing showing the appearance, structure, or workings of something; a schematic representation. VERB (TRANSITIVE). Represent (something) in graphic form. (definition from lexico.com)
How do diagrams work?
The design fields have developed a specialized language for representing the “workings” of architecture and related design fields, including:
- spatial and organizational relationships
- formal characteristics
- design concepts
- movement and circulation
We’ll revisit some of the most relevant of these shortly, but first a quick step back to look at some of the decisions that go into developing a diagram. Images in the slideshow below are all diagrams of the human pulmonary system.
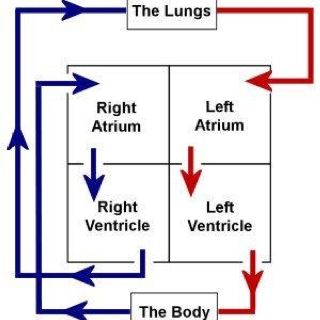
FULLY ABSTRACTING THE ORGANS AND BLOOD FLOWS (EXCEPT THE MAJOR PARTS OF THE HEART) 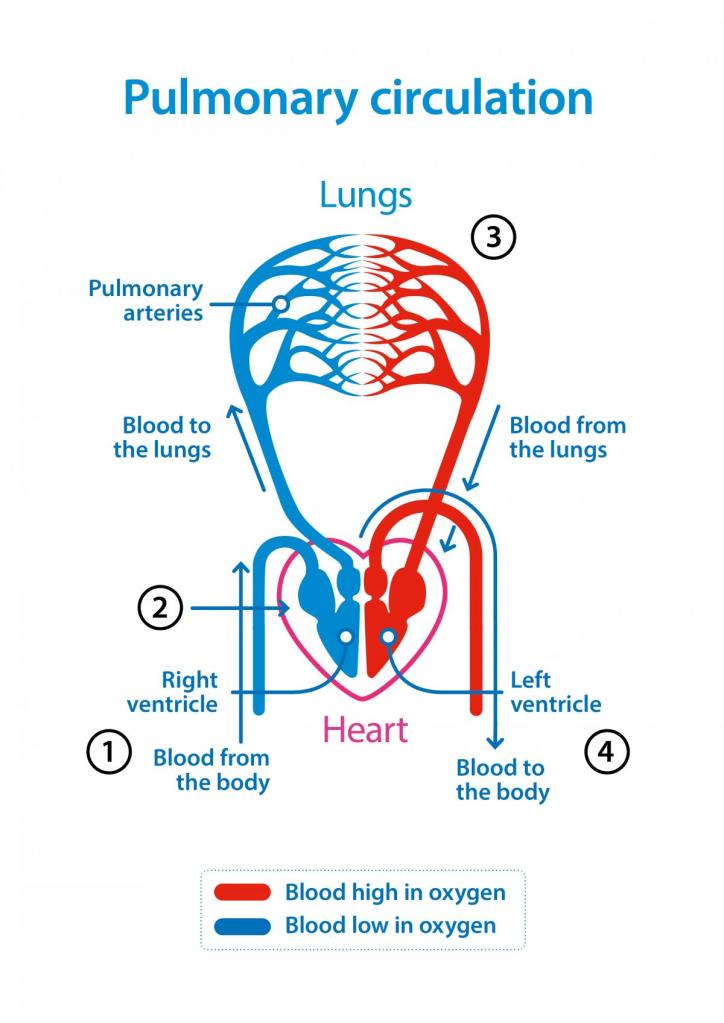
GRAPHICALLY SUGGESTIVE OF THE HEART AND LUNGS, OMITTING THE REST OF THE BODY 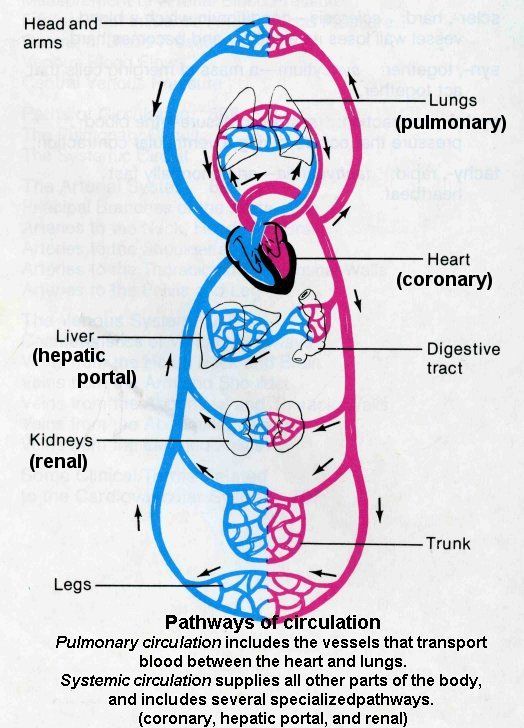
INTRODUCING THE ACTUAL PHYSICAL APPEARANCE OF THE ORGANS AND DETAIL OF THE MAJOR PATHWAYS OF BLOOD FLOW 
FULLY CONTEXTUALIZED WITHIN THE BODY 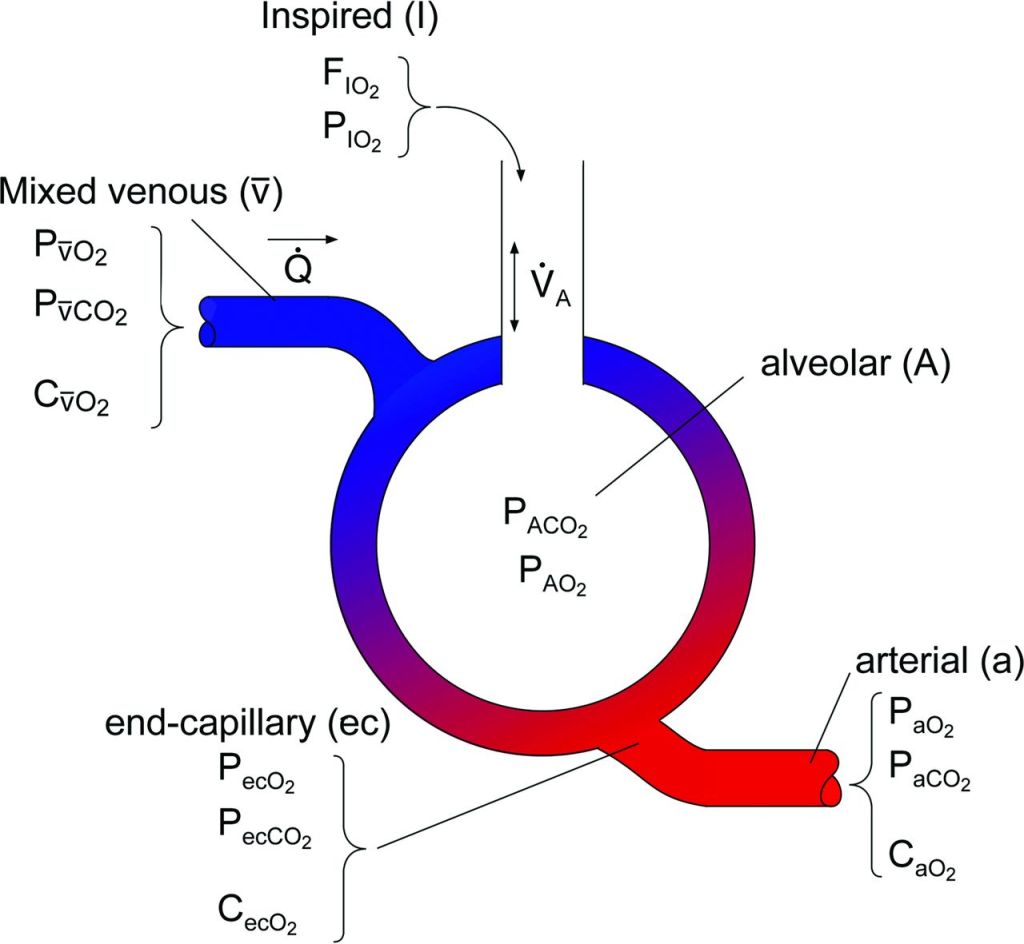
ABSTRACTED AND SIMPLIFIED- USE TO CONTEXTUALIZE DATA (ON OXYGEN AND CO2 LEVELS IN THE BLOOD IN DIFFERENT LOCATIONS)
Think about the graphic choices (line, color, text, arrangement…). Where are the diagrams using similar techniques and where are they different? Despite some similarities each diagram also differs in the choices of what aspects of the pulmonary system to emphasize, simplify, or even omit. What does each convey most clearly to you? How do they succeed (or fail) in focusing your attention and communicating to you? When you develop diagrams you’ll make similar choices of emphasis, abstraction, simplification, omission, and overall graphics.
Diagram Types
Venn and Euler Diagrams
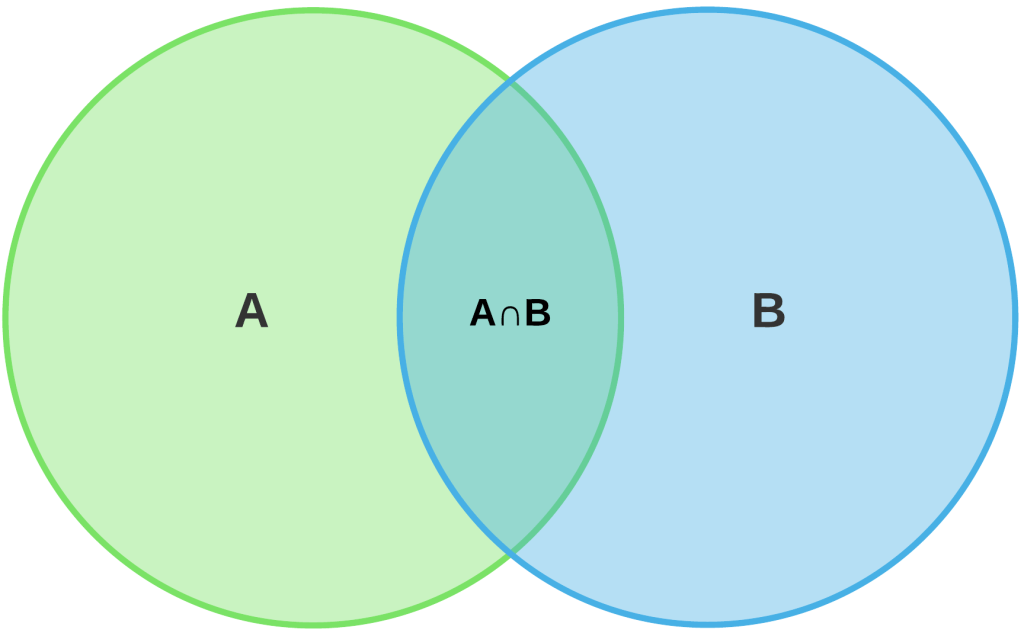
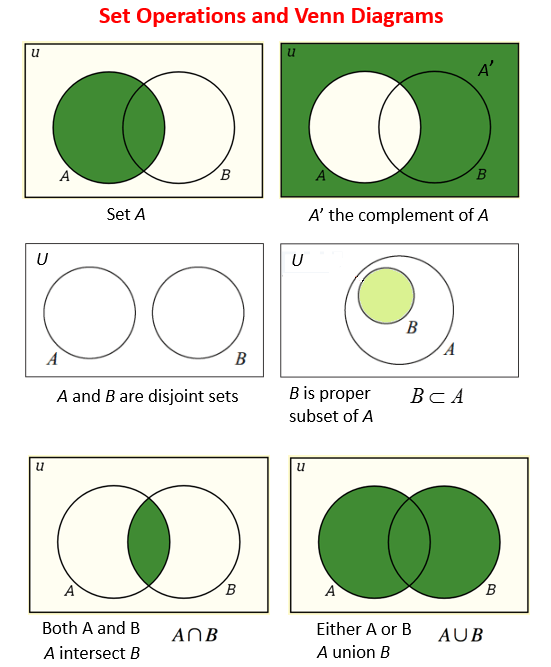
You may be familiar with venn diagrams from other classes: using the outline of a shape (usually a circle) to represent a group of things sharing certain characteristics (called a set). The relationship of different sets can be shown diagrammatically.
Venn diagrams can be used very literally to show complex relationships between sets of data or loosely adopted to show the concepts of overlap, sharing, as well as separation or distinction.
DIFFERENT RELATIONSHIPS BETWEEN TWO SETS 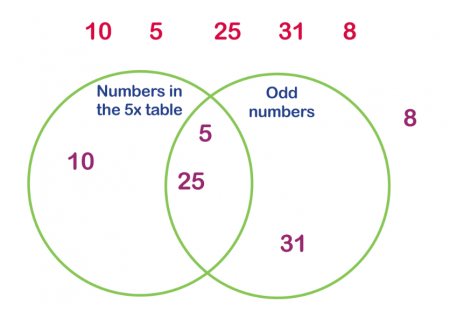
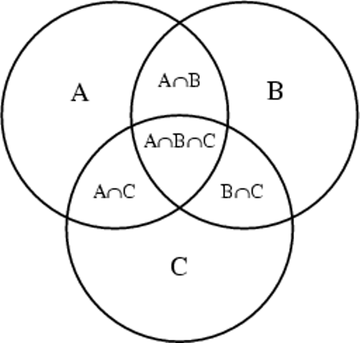
INTERSECTION OR OVERLAP BETWEEN THREE SETS 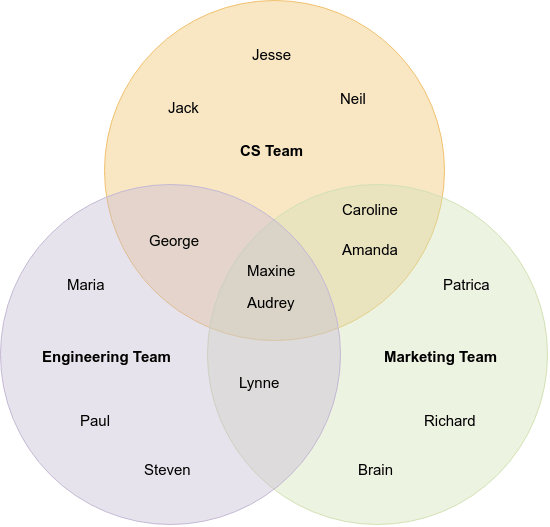
3 TEAMS (SETS OF PEOPLE). SOME PEOPLE ARE ONLY ON ONE TEAM, OTHERS ON TWO OR THREE. 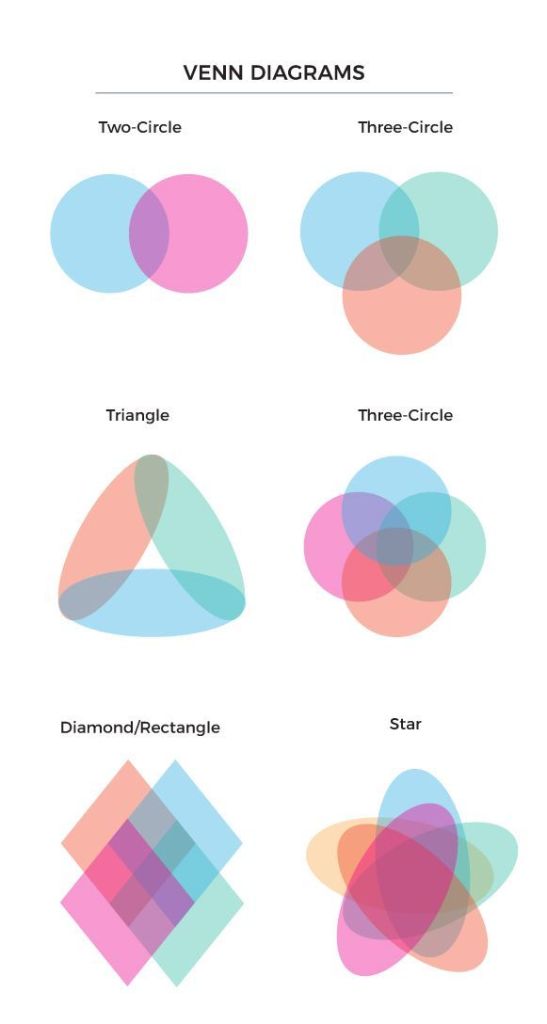
THE GEOMETRY OF THE SETS CAN BE ADJUSTED TO CREATE DIFFERENT OVERLAPS 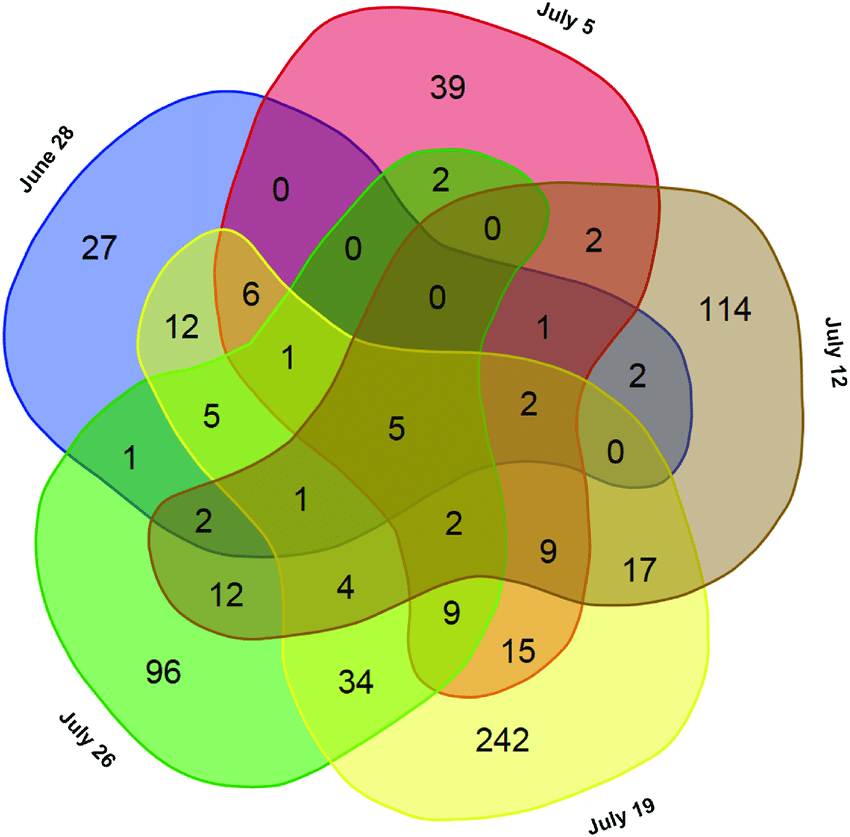
A MORE COMPLEX SET OF DATA: NUMBERS REPRESENT THE PEOPLE THAT WERE PRESENT ON A CERTAIN DAY, EACH SET REPRESENTS A SPECIFIC DATE.
Adjacency, Program, or Bubble Diagrams
architects frequently use a graphic language similar to that of venn diagrams to show programs (uses) and their required adjacencies.
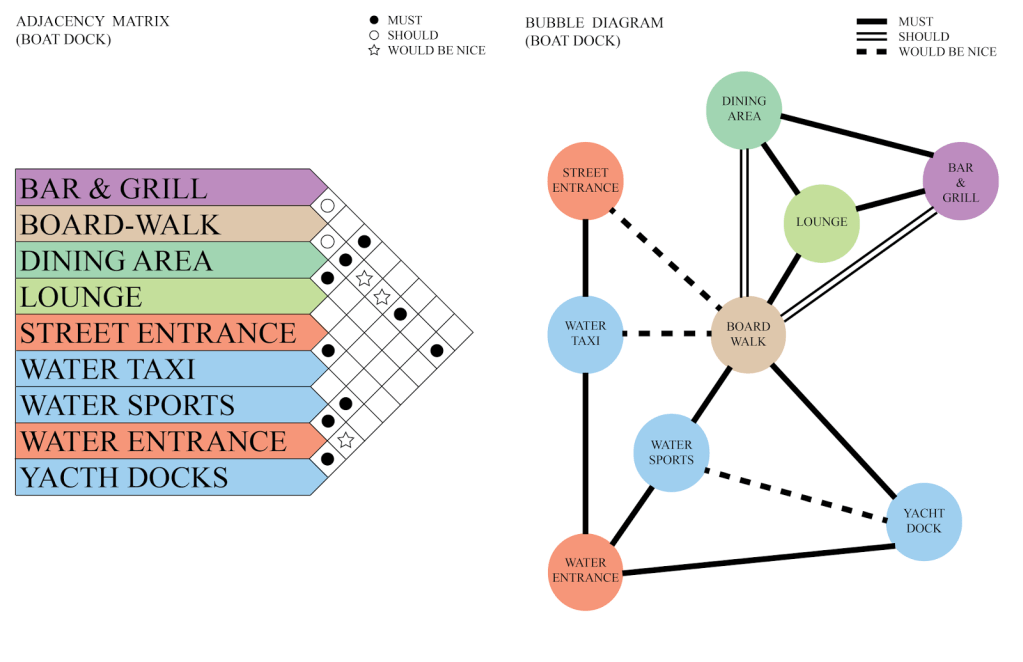
In their basic form these can be fairly abstract diagrams (like the bubble diagram above). But they can also incorporate additional layers of information, ranging from the the “sizes” of different programs to their overlaps and relationships to other elements or characteristics of a site.
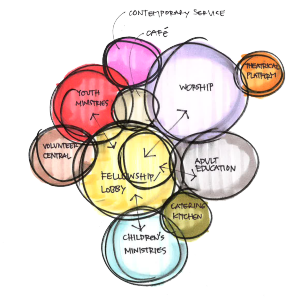
A RELIGIOUS PROGRAM. NOTE THE PRIMARY ADJACENCIES INDICATED WITH ARROWS AND THE LOBBY AS A FUNCTION WITHIN LARGER “FELLOWSHIP” USE 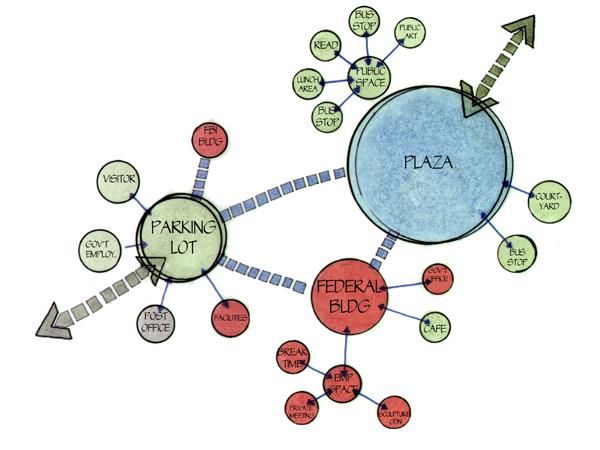
WITH SOME INDICATION OF SCALE AND HIERARCHY OF CONNECTIONS 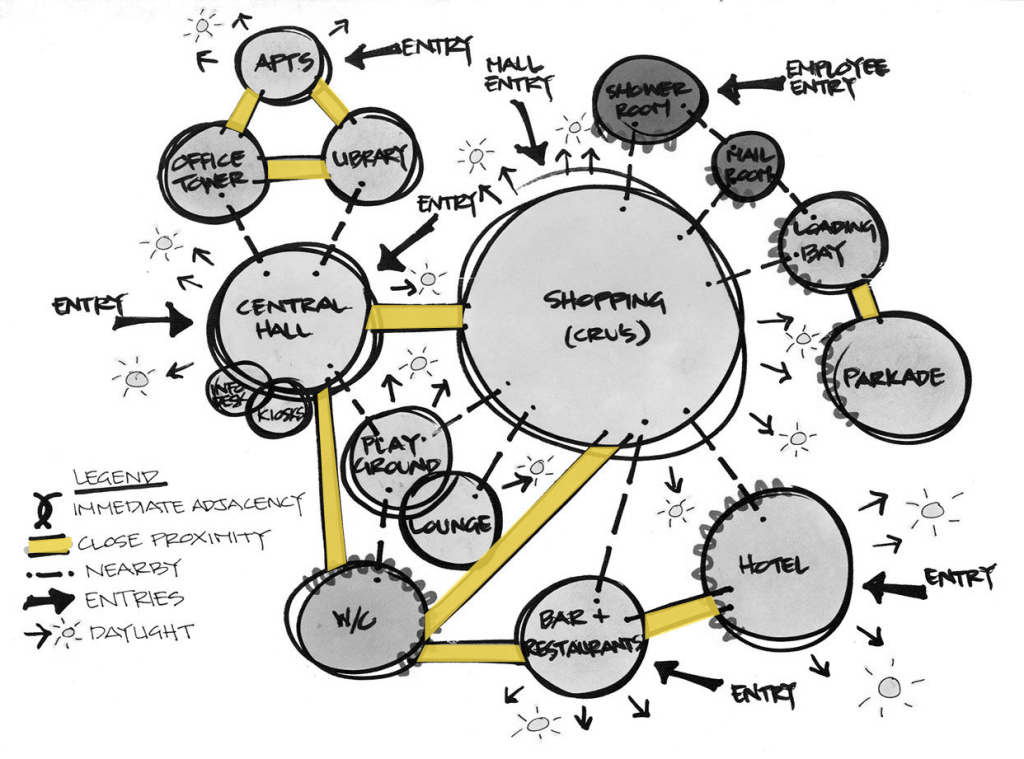
ELABORATING ON THE SPECIFIC NATURE OF RELATIONSHIPS, INCLUDING TO DAYLIGHT AND POINTS OF ENTRY 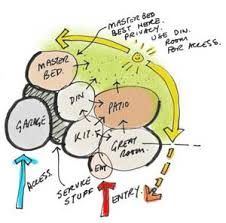
A RESIDENTIAL DIAGRAM SHOWING THE LITERAL PATH OF THE SUN AND ITS AFFECT ON THE ORGANIZATION OF SPACES
In the above diagrams you can see how “functions” are often the same as “spaces”. Bubble diagrams are often created early in the design process, before there is an architectural design, but are also used as a design develops to highlight uses and adjacencies and when analyzing an existing design. Like the example of the pulmonary diagram these can be more or less strongly tied to the physical representation of he spaces. (For now we’re focusing on 2D drawings like plan and section, but later will look at 3D examples as well.)
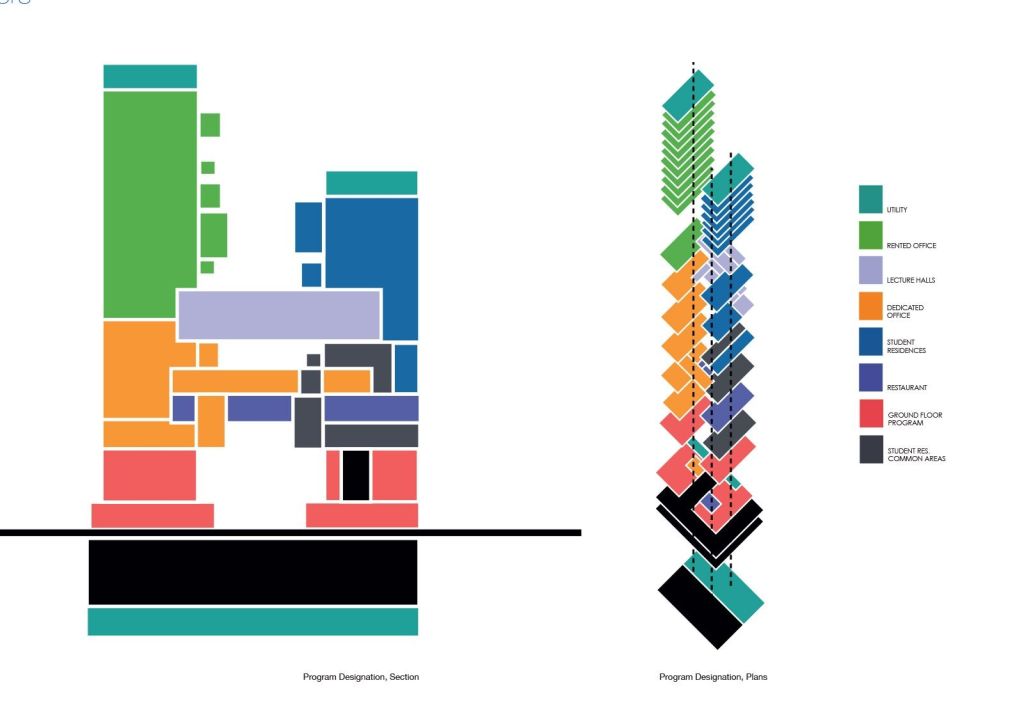
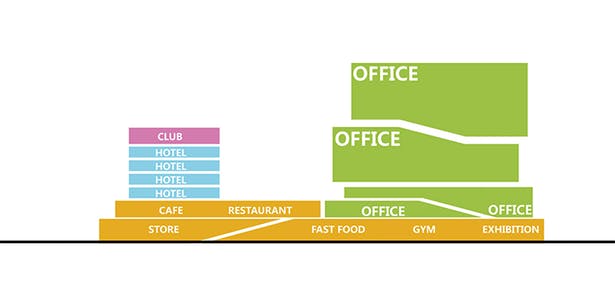
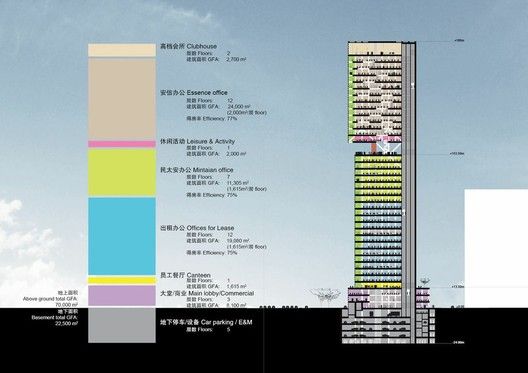
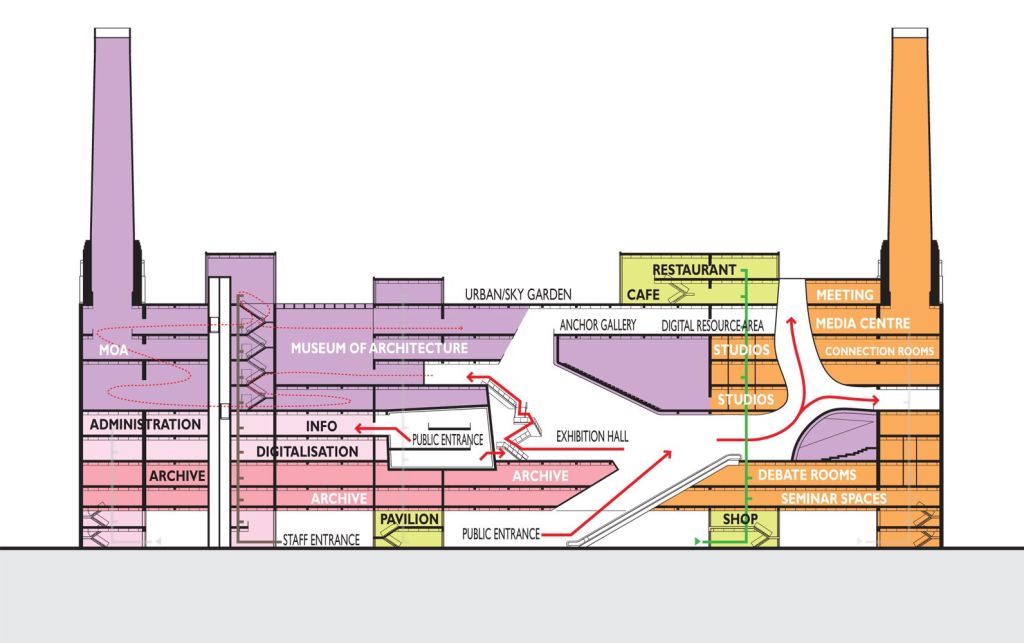
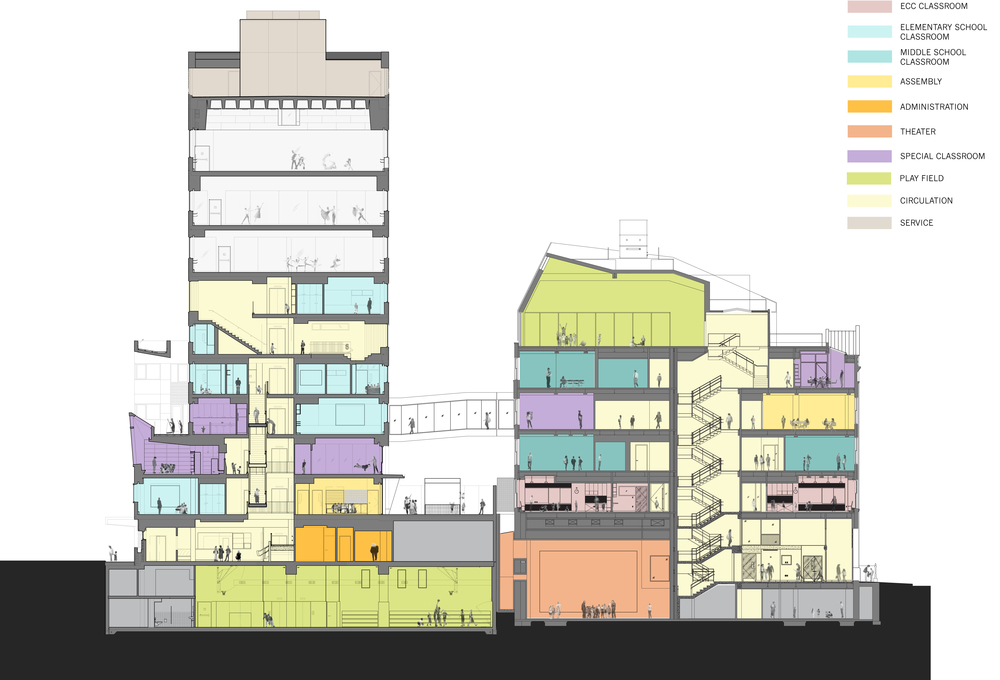
Circulation & Movement
Similar to program uses becoming program spaces, the adjacencies of abstract bubble diagrams often develop into literal circulation paths as the diagrams become more closely based on actual physical spaces .
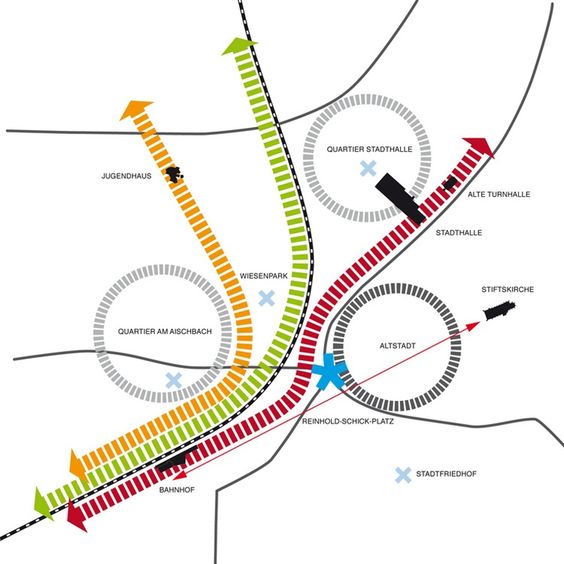
(PROBABLY) BUILT OVER A SCALED PLAN, BUT THEN ABSTRACTED TO EMPHASIZE PATHS AND CONNECTIONS 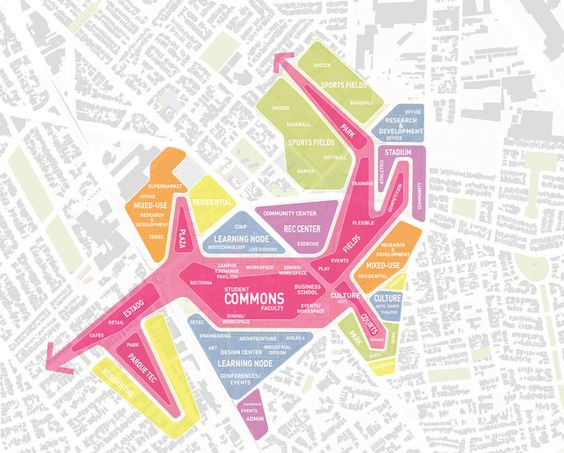
PROGRAMS WITHIN A DESIGNATED AREA, WITH AN EMPHASIS ON URBAN SPACE AND CONNECTIONS 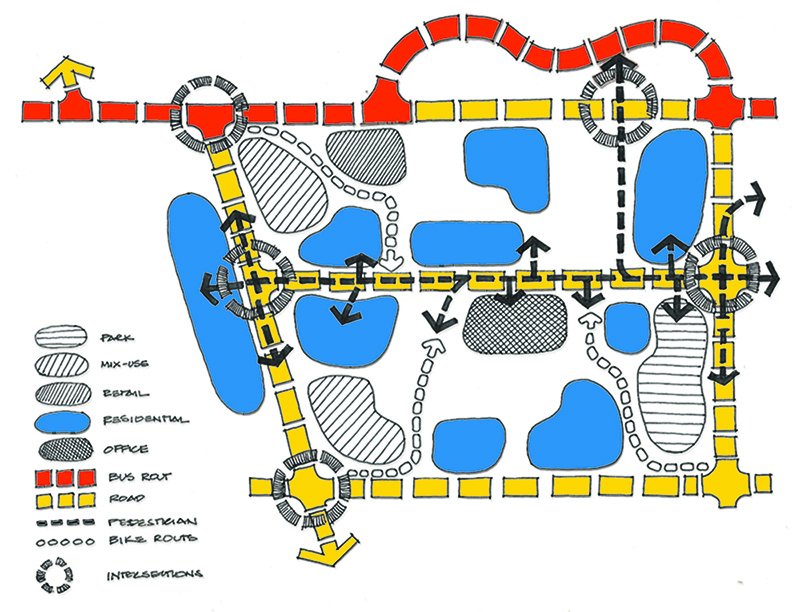
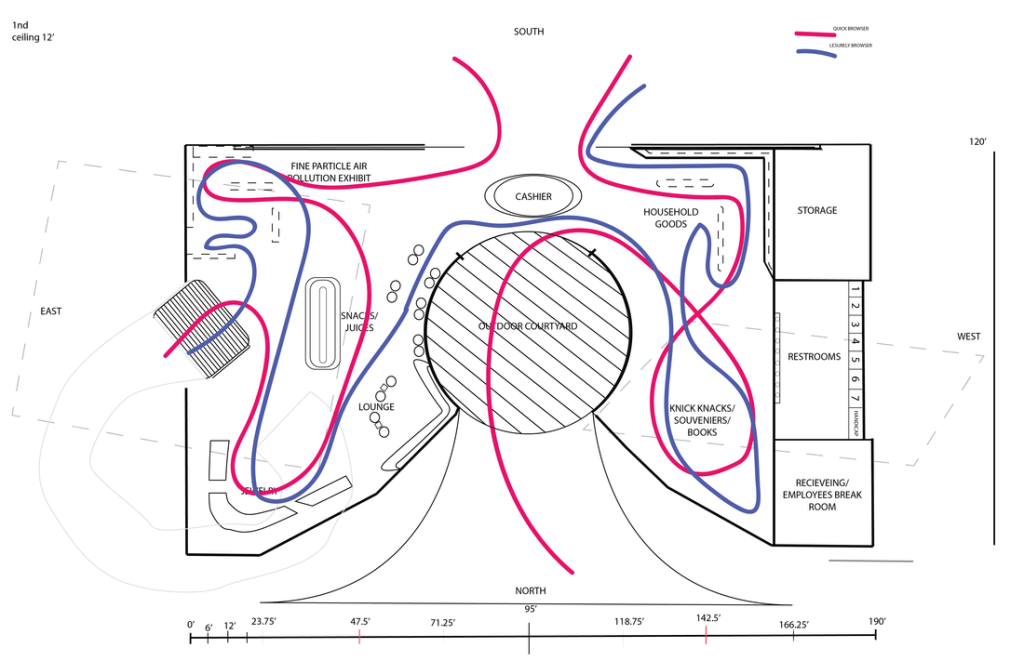
DIFFERENT FORMS OF CIRCULATION AND RELATIONSHIPS TO DIFFERENT PROGRAMS 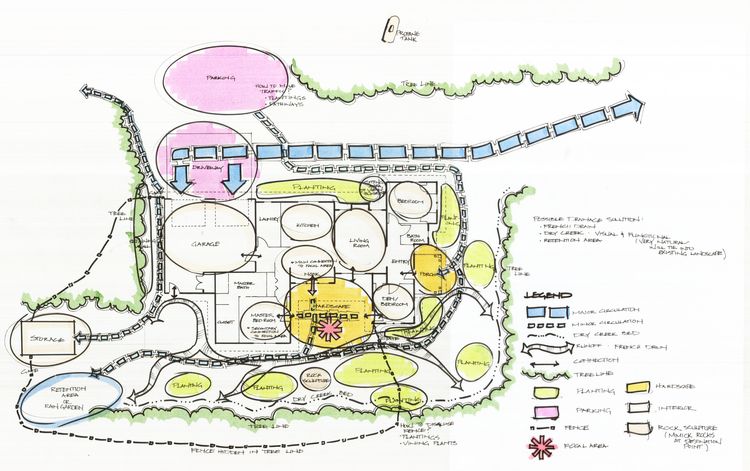
CIRCULATION AND SPACE RELATIONSHIPS OVERLAID ON A SITE/FIRST FLOOR PLAN
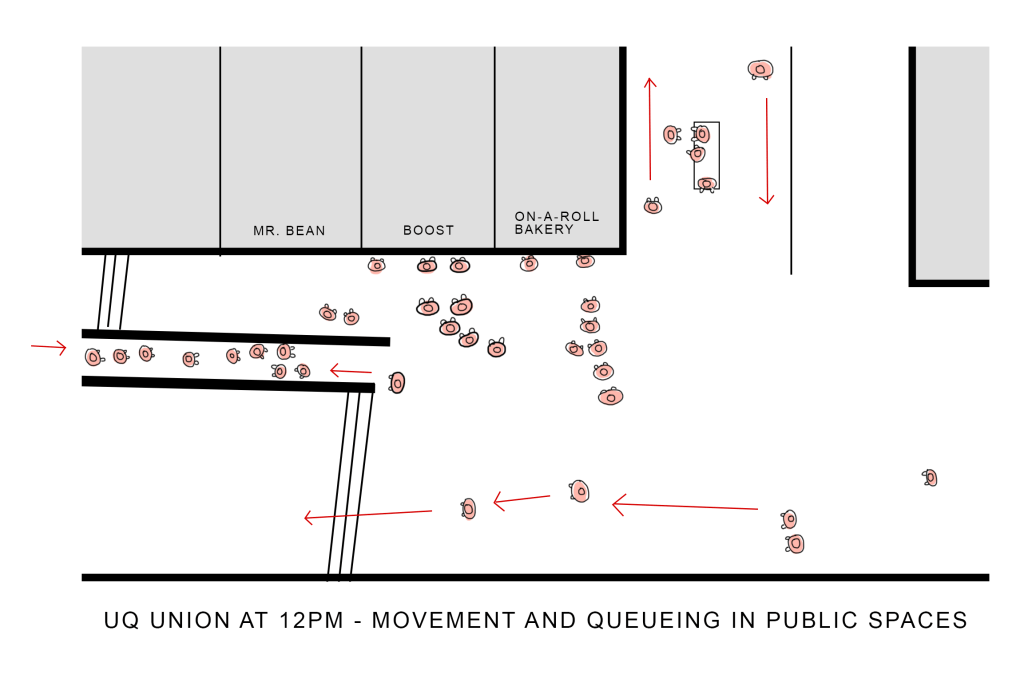
Specificity
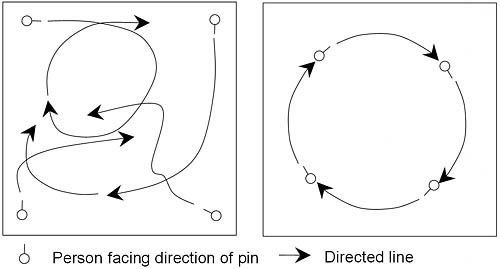
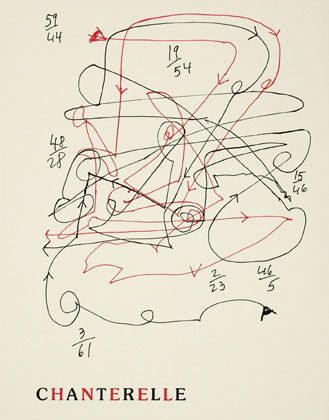
Especially within existing spaces the movement of people or groups can be tracked or diagrammed (Design software also can create predictive models.)
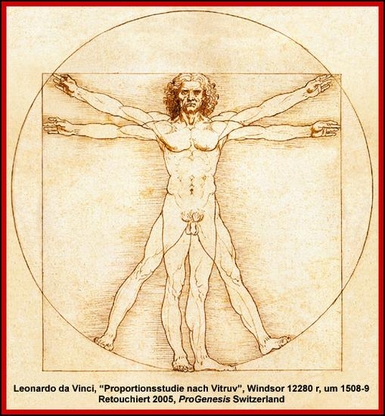
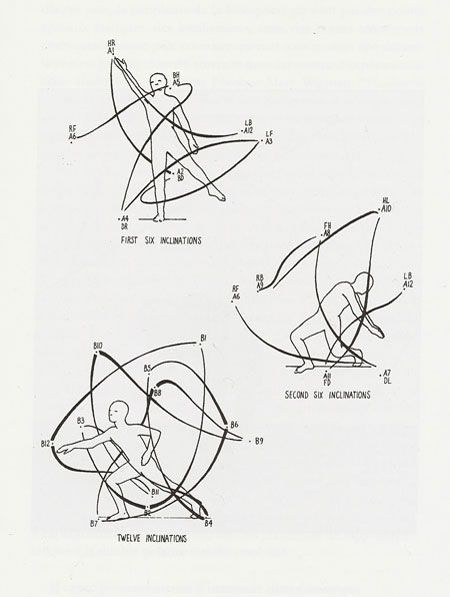
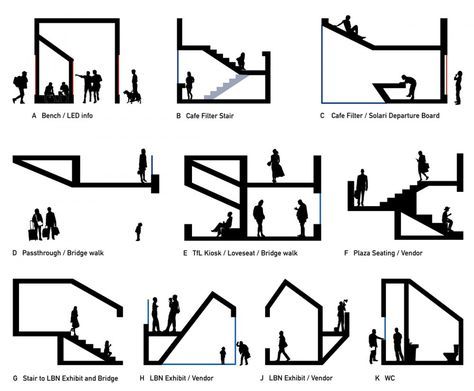
The Body in Space
Perhaps more relevant to some of your examples for the first assignment would be to consider movement and space at the scale of the body.
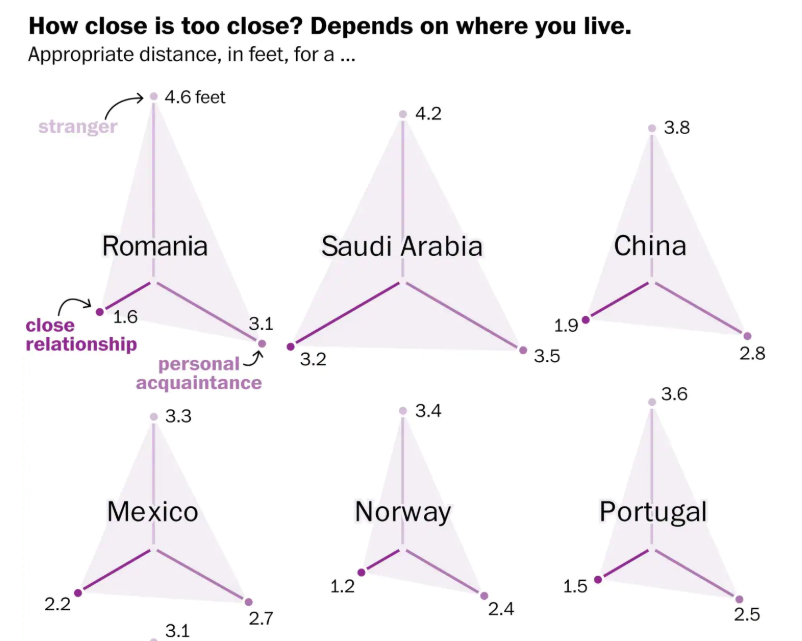
Some Other Ideas
There are other characteristics that could be diagrammed and relate to our comfort and privacy in a space.
- VISIBILITY or VISION
- BOUNDARY or BARRIER
- INTERACTION or CONNECTIVITY
Think of others that may be relevant even if you’re not sure how or how they might be diagrammed.
